Get started
How it works
Concept Cartography helps you draw a map of ideas. Each idea is a circle on the map, and the lines between them show how the ideas are connected. You can build a map on your own, or with a class, a study group, or a research team. You don't need any technical skills, and there is nothing to install. This guide walks you through your first map, one step at a time.
The two words to know
A concept is one idea, such as Photosynthesis or Sunlight. It appears as a circle on the map.
A link connects two concepts and says how they are related, for example Photosynthesis depends on Sunlight. It appears as a line between the circles.
1. Sign in with your name
Click Sign in in the top-right corner and type the name you'd like other people to see. You don't need a password or an email address.
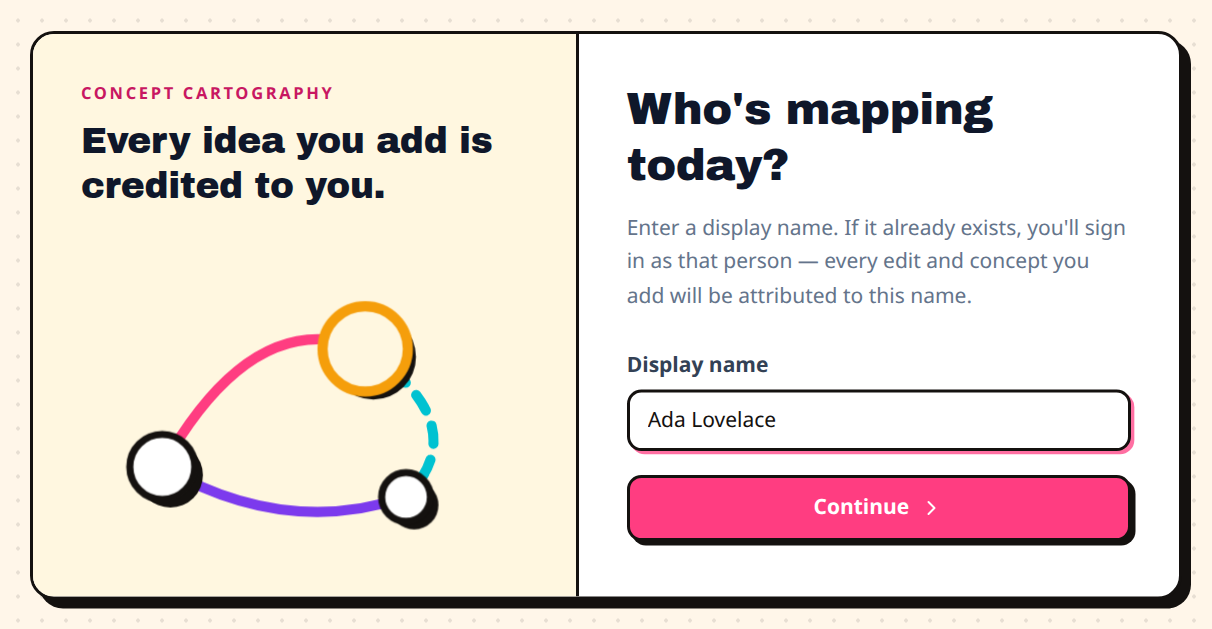 Type a display name and press Continue.
Your name appears next to everything you add or change, so everyone can see who contributed what. To sign in again later, type the same name.
2. Start a new map
Go to Maps and click New map. Give your map a name, and if you like, a short description of what it's about. Then click Create map.
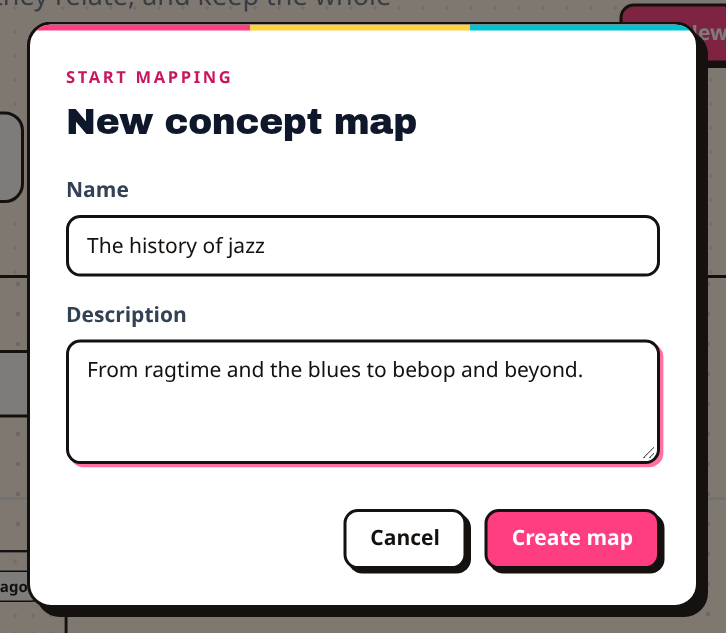 A map needs a name. The description is optional, but it helps other people understand what the map is for.
A map can be about anything you want to understand better: a topic from a course, a research question, a book you're reading, or a hobby.
3. Add your first concepts
On your new map, click Add concept in the Tools panel on the right, or press the N key. Only the name is required. You can also add:
- a definition that explains the idea in a sentence or two;
- sources, which are links to where the idea comes from, such as an article, a book, or a web page;
- an example that makes the idea concrete;
- a quiz question that someone could use to test their understanding.
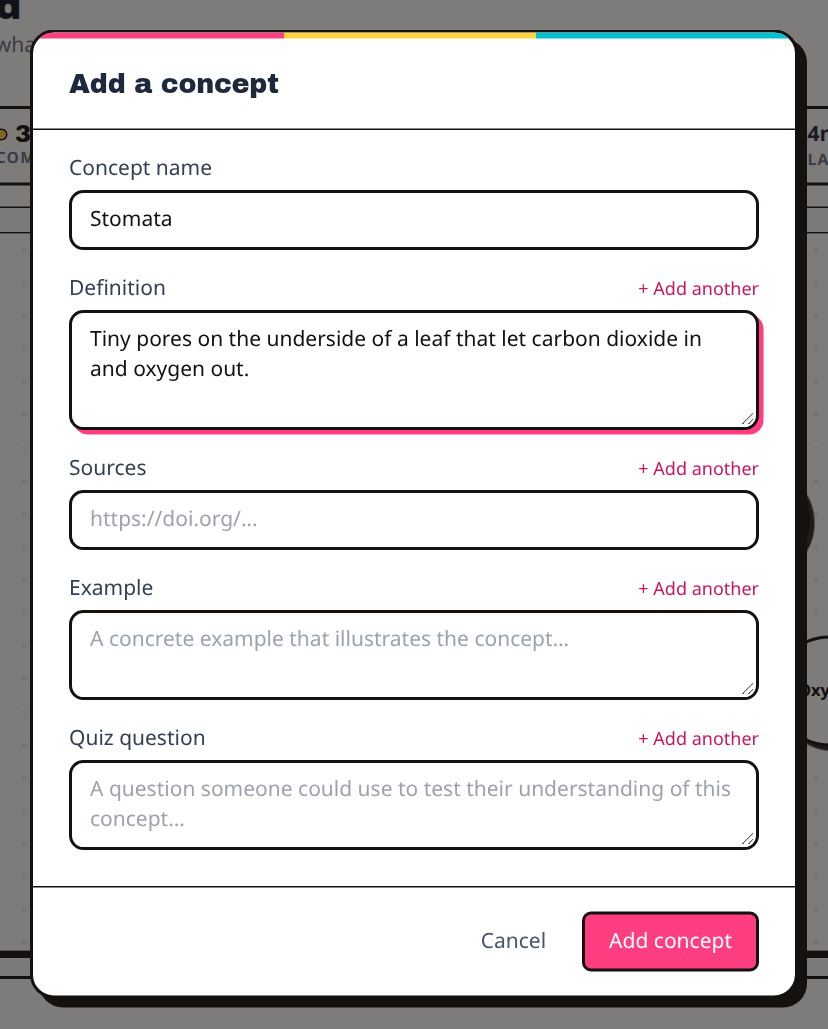 Adding a concept called "Stomata". You can fill in the other fields now or come back to them later.
Tip: right-click an empty part of the map to add a concept at that exact spot.
4. Link concepts together
Links are what turn a list of ideas into a map. Click Add link in the Tools panel, or press L. Then:
- choose the concept the link starts from;
- choose the kind of relation;
- search for the concept it goes to;
- optionally, add a sentence explaining the link.
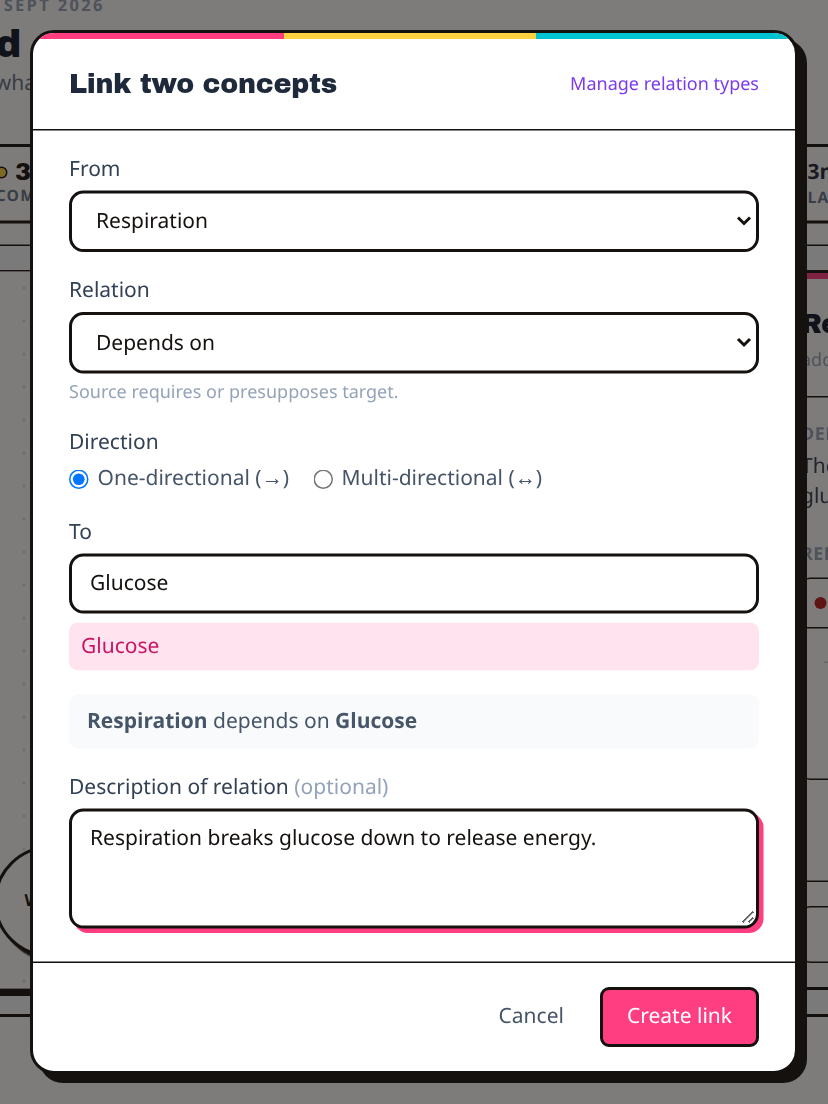 Before you save, the window shows how the link reads as a sentence: "Respiration depends on Glucose".
Concept Cartography has eight built-in kinds of relation, each with its own colour:
- Type of: one idea is a kind of another. A robin is a type of bird.
- Part of: one idea is a piece of a larger whole. Chlorophyll is part of a leaf.
- Produces: one idea causes or creates another. Photosynthesis produces oxygen.
- Counteracts: one idea works against another.
- Depends on: one idea needs another. Photosynthesis depends on sunlight.
- Similar to, Equivalent to, and Distinct from: for comparing ideas.
Most links point one way and are drawn with an arrow. If a relationship works in both directions, choose Multi-directional. If none of the built-in relations fit, click Manage relation types to create your own for this map.
5. Arrange your map
As you add concepts, they appear on the map. Drag a circle to move it. The map saves your layout, so everyone who opens the map sees the same arrangement.
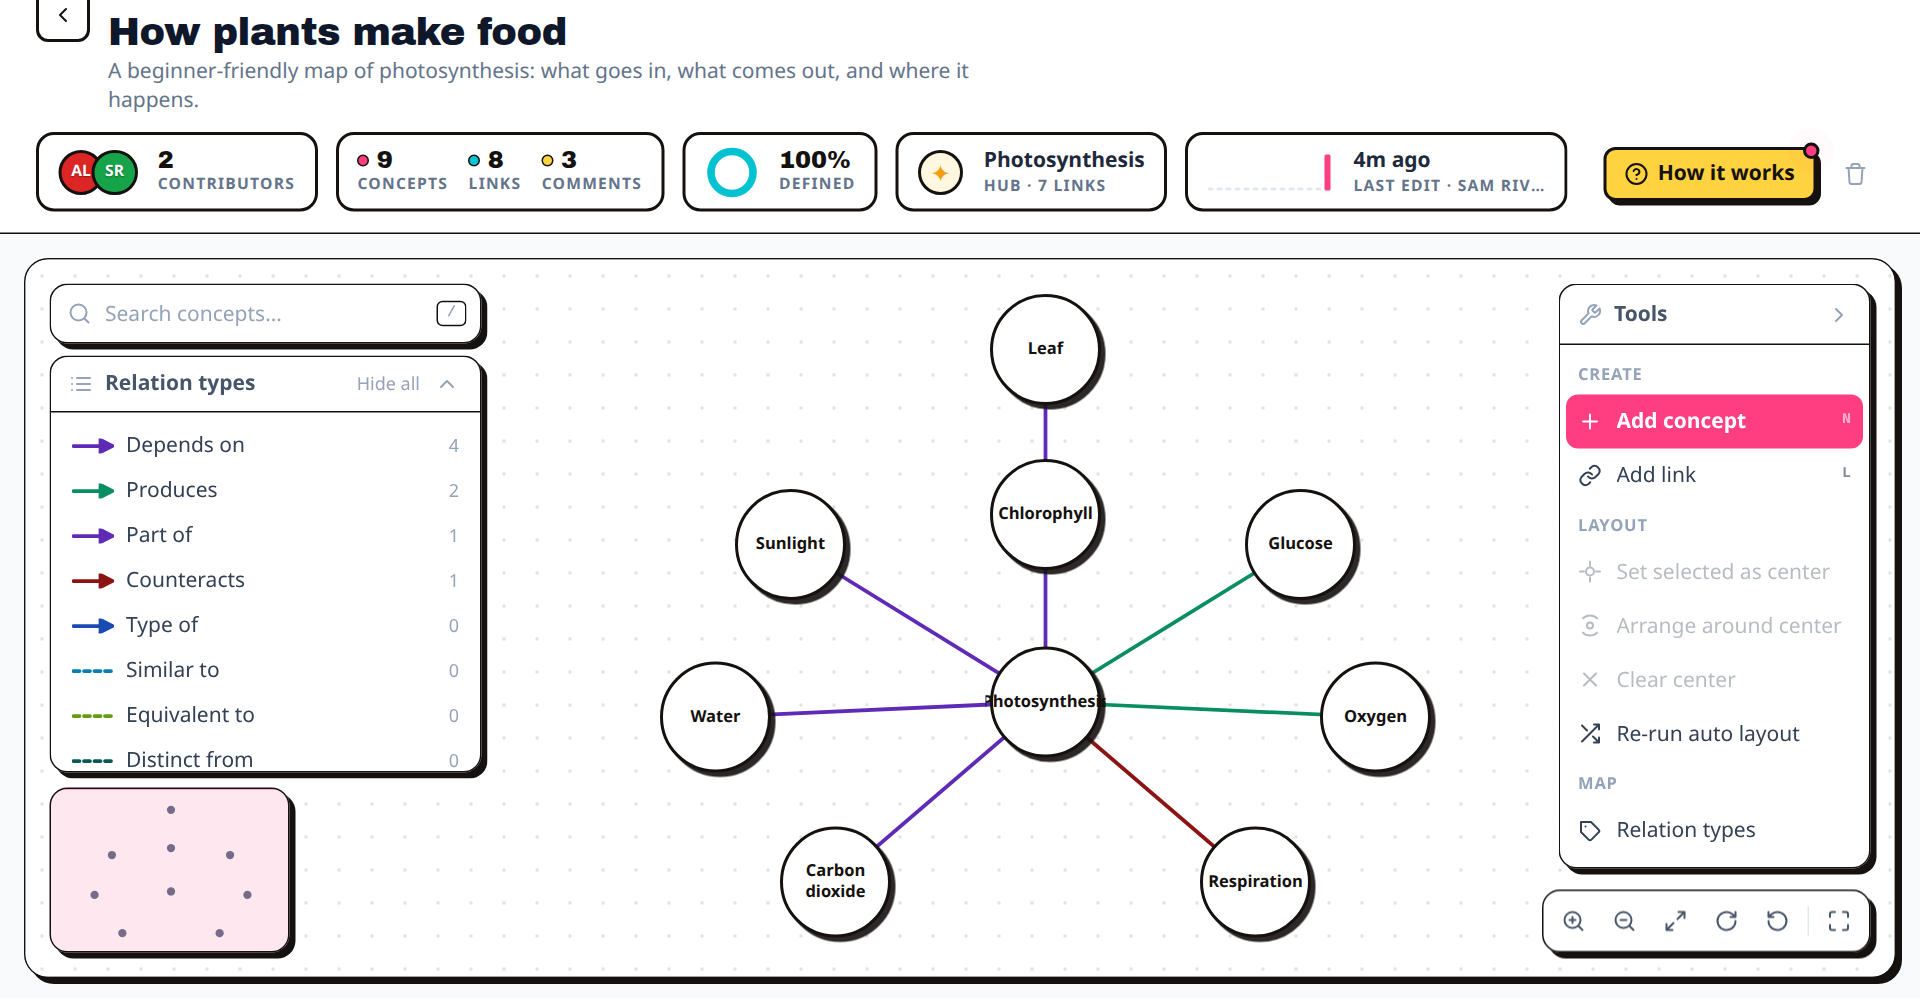 A finished map. The Relation types list on the left explains what each line colour means.
Some useful ways to find your way around:
- Zoom by scrolling, pinching with two fingers on a touch screen, or with the buttons in the bottom-right corner.
- Move around by dragging an empty part of the map.
- Press 0 to fit the whole map on your screen.
- Hover over a concept to highlight the concepts it's linked to.
- Search for a concept by name with the box in the top-left, or press /.
If you ever forget a shortcut, click How it works at the top of any map.
6. Explore a concept
Double-click any concept to open its details. The panel shows the concept's definition, sources, examples, and quiz question, along with every other concept it's linked to.
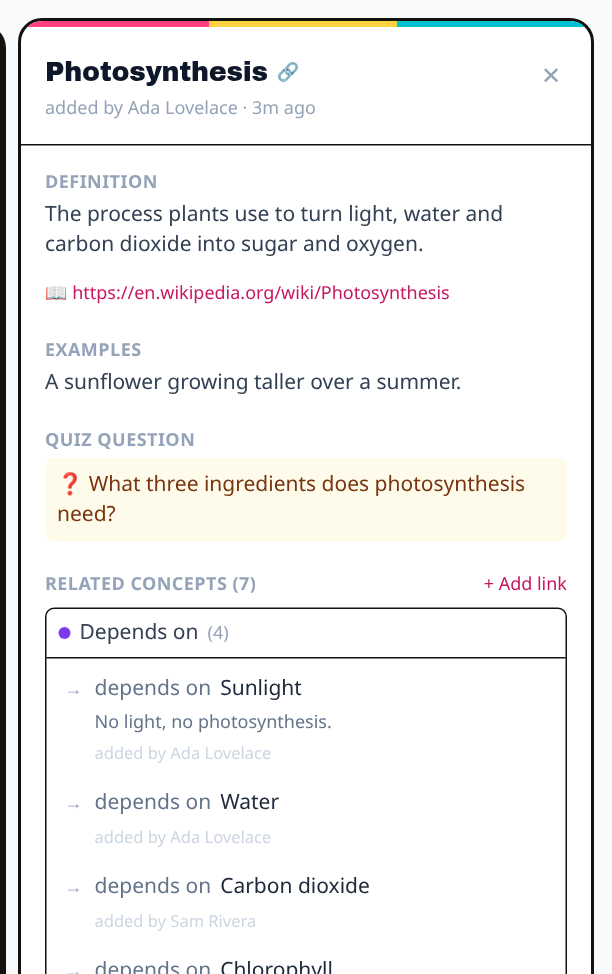 The details panel for Photosynthesis. Click any related concept to jump straight to it.
From here you can Edit the concept, add a new link from it, or click the link icon next to its name to copy a web address that opens the map with this concept already selected. This is handy for sharing a specific idea in an email or a class chat.
7. Discuss a link
People don't always agree on how two ideas relate, and those disagreements are often where the real learning happens. Click any line on the map to open its discussion.
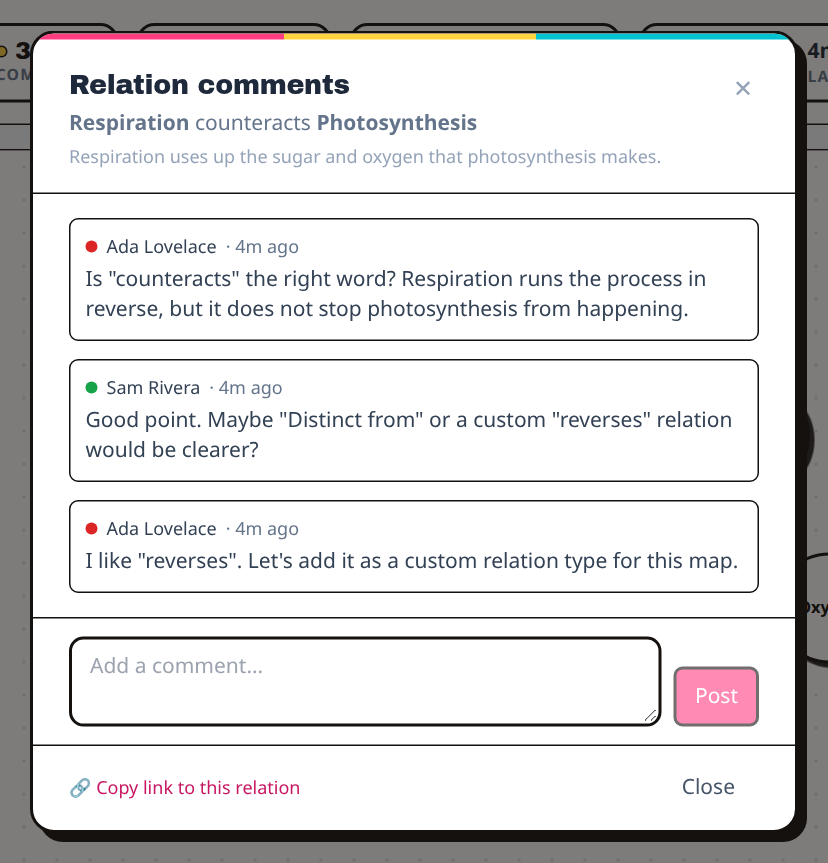 Two contributors discuss whether "counteracts" is the right way to describe a link.
Comments stay attached to the link they're about, so anyone who looks at the link later can follow the reasoning. You can also copy a web address that opens this exact discussion.
8. See what has changed
Every map keeps a record of who did what, and when. Open Activity feed from the Tools panel to see it.
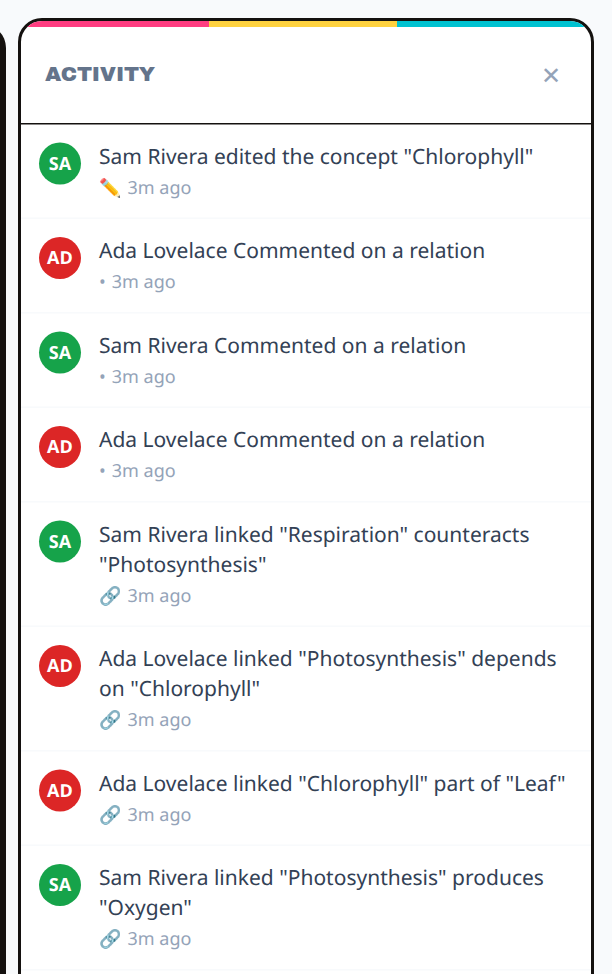 The activity feed shows the latest changes first.
This makes it easy to catch up on what others have added since your last visit, and it means every contribution is credited to the person who made it.
9. Search every concept
The Concepts page is a shared dictionary of every concept from every map. Search it before you add a new concept: someone may already have defined it, and you can build on their work instead of starting again.
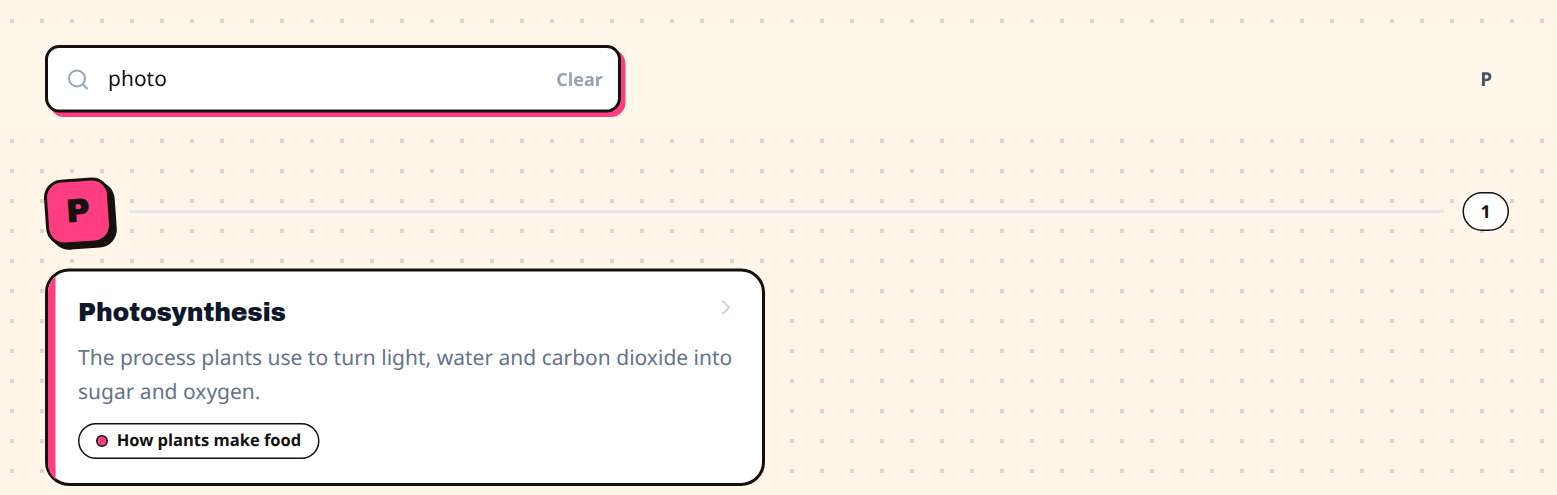 Searching the dictionary for "photo" finds Photosynthesis and shows which map it belongs to.
Where to go next
- Read Philosophy of concept cartography to learn why mapping ideas helps people understand them.
- Read Governance for guidance on looking after a map that other people share.
- Read Citing the atlas if you want to reference a map in your own work.
Have fun mapping. The best maps grow over time, one concept and one conversation at a time.